Category: Option Trading

  • How Implied Volatility Can Make Money, A Lot of It

    The most powerful force is an “invisible” one; because you can always prepare for the visible forces but the one that can cause most gain or pain is the one that you can’t see. Implied volatility is one such force when trading financial markets. I introduced Ms Vega as personification for Implied Volatility. Depending upon which side are you at, Ms Vega can either bring lot of money to your portfolio or can easily make you cry. Those who don’t know about implied volatility, pls click here to know more about it.

    It is a commonly known fact amongst options traders that before earnings announcement, implied volatility of underlying increases. Let’s stay with the simple facts-

    1. Implied Volatility rises before earning.
    2. For the stocks that tends to move a lot (how to play) usually there is Implied Volatility skew between the earning month and the month before/after.

    Insiders/Outsiders who might have “earnings date” can make a lot of money. All one need to know a) the earning date with certainty and/or b) changes in the earnings date before those are announced to the public and bingo!!! Let me explain this more with the following two examples-
    (more…)

  • A Bullish Trade on Whiting Petroleum Corporation (WLL)

    Whiting Petroleum Corporation (NYSE: WLL)  yesterday announced that its Board of Directors declared a 2-for-1 split of Whiting’s common stock to be effected through a stock dividend. According to the news- “Stockholders of record at the close of business on February 7, 2011 will be entitled to receive one additional share of Whiting common stock for each share of common stock owned as of that date. Whiting anticipates that the additional shares of common stock to be issued as a result of the stock dividend will be issued in book-entry form on or about February 21, 2011.”

    Originally I wanted to share this trade idea yesterday when WLL was bouncing of it’s 50days moving average but couldn’t as I spent time on NFLX earnings instead. In any case, I think WLL still offers a good opportunity due to this event. Firstly for those who don’t know WLL, here is a brief description from Google Finance-

    Whiting Petroleum Corporation is an independent oil and gas company. The Company is engaged in acquisition, development, exploitation, production and exploration activities primarily in the Permian Basin, Rocky Mountains, Mid-Continent, Gulf Coast and Michigan regions of the United States. During the year ended December 31, 2009, the Company’s average daily production was 55.5 thousands of barrels of oil equivalent/day (MBOE/d). As of December 31, 2009, its estimated proved reserves totaled 275 million barrels of oil equivalent (MMBOE). The Company’s Permian Basin operations include assets in Texas and New Mexico. As of December 31, 2009, the Permian Basin region contributed 123.3 MMBOE of estimated proved reserves to its portfolio of operations, which represented 45% of its total estimated proved reserves and contributed 11.7 MBOE/d of average daily production in December 2009.

    So how to play WLL stock split announcement via Options–

    The Basic concept is that stocks usually trends up leading into the split day and it is so because many investors/traders think that stock split is a sign of confidence; and since majority follows it, it also serves as a self-fulfilling prophecy. Of course not all the stocks that announce split goes up, so one has to be selective in choosing to play this “potential uptrend”  that might last for a few weeks. And I think WLL maybe one of those that might rise. Attached below is a 1 year chart for WLL.

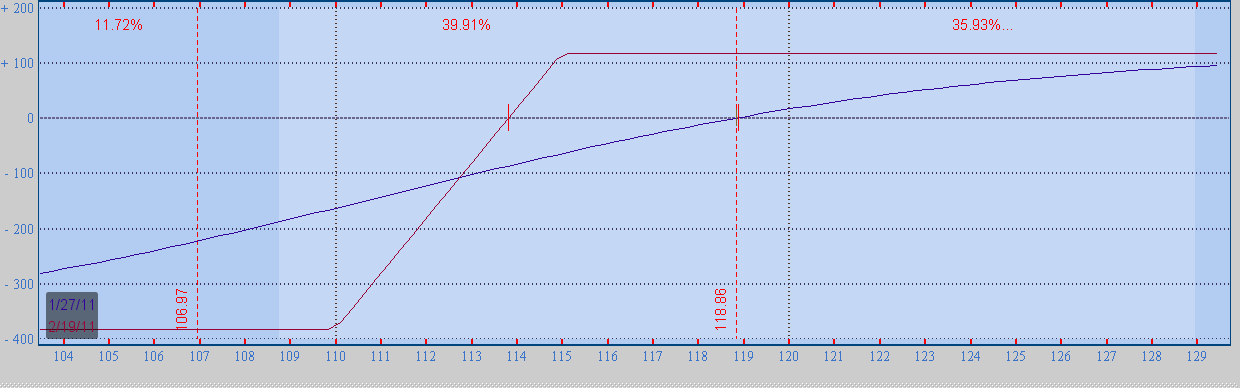
    A Bull call debit spread or a Bull Put vertical credit spread good be one of the ways to play a potential uptrend. I am personally of the opinion to sell to open a Feb 115/110 Bull Put Vertical spread. As of yesterday close, this spread will bring $1.17 credit and thus $3.83 on Margin. By Feb’11 expiration, if WLL stays above $115, it may generate 30%  returns x-commissions. The Break-even for this trade will be $113.83 (=$115-$1.17) below which the trade will start to lose money and will lose 100% by Feb expiration if either a) it is not adjusted or b) not taken off for a loss. I usually prefer to book profit/loss at 15-18%. Here is the risk reward chart for the trade-

    This is a Theta positive, negative vega trade. Once it’s set, you can leave it but monitor for stock movement. As long as stock isn’t trading below $115, the trade will be fine.  30% for less than 4 wks (assuming WLL is above $115 by Feb expiration) is an excellent risk/reward for a limited risk strategy. Just make sure that you have a risk management plan in place should WLL move against your position. For a starter, one of the simple adjustment plan is to open a Bear Call spread and convert into a fly as soon as you are feeling uncomfortable with the position.

    Disclaimer– As of this writing, I don’t have any positions in WLL, but I may open anytime. I may open either any of the strategies discussed above or a different one. I may also change my opinion anytime. Pls do proper due diligence before investing even a single $.

    Profitable Trading, OP

  • Let’s Get Ready for 2011

    We have seen a great bull and a mild bear  market (which actually didn’t go as wild as it could have been) thanks to Greed and Fear of the Wall Street and those who packaged junk and guess what Wall Street is about to witness record revenue in 2009-10-recovery, thanks to trillions in the form of Government bailout(s). With record revenues also come record bonuses which we’ll get to know only early next year. But guess what, the little guy who provided money to bailout banks is still licking his wounds. He/she doesn’t even realize what the heck has happened and despite spending humongous amounts of money he is still jobless. And the sad part is, that he/she will probably continue to fall victim to the same game, over and again. Click here to read an article from ZeroHedge that points to extreme optimism prevailing in the markets.

    Do you really want to understand what’s going on. Here is a simple write-up “Fed’s QE Ponzi Scheme begins to backfire” by Gary Dorsch of Global Money Trends magazine

    In a taped interview with CBS’ “60 Minutes” that aired on December 5th, Federal Reserve chief Ben “Bubbles” Bernanke tried to brainwash the American public, into believing that “Quantitative Easing” (QE), is absolutely necessary in order to prevent further losses of jobs, and tried to assure his listeners that he has the skills to keep inflation under control. The US-jobless rate would have risen far higher, “something like it was in the Depression, at 25%,” — had the Fed not provided tens of trillions in loans to Wall Street banks and other financial companies, he said.

    Two-years ago, the Wall Street Oligarchs played the central role in the greatest financial scandal in the history of the world, – one which wiped out tens of trillions of dollars in wealth, nearly bankrupted giant corporations and entire countries, and plunged the world into the deepest slide in global trade since the Great Depression. Huge profits were made in sub-prime mortgages, based on a Ponzi scheme of exotic financial derivatives and sliced packages. When it came crashing down, the public treasury was looted to cover the financial aristocracy’s losses.

    Since then, the Fed has carried out QE-1 between March 2009 and March 2010, in which it bought $1.45-trillion in mortgage-backed securities and $300-billion in Treasuries. Together with pegging interest rates at zero-percent, weakening the US-dollar, and flooding the stock markets with cheap credit, – the Fed enabled US banks and S&P-500 companies to record bumper profits, even as they slashed jobs and capital spending, and suffered revenue declines.

    With QE-1, the Fed channeled interest free money into the coffers of the Wall Street Oligarchs, which in turn, was used to buy higher yielding Treasury bonds. In a single stroke, the Fed monetized the US-government’s debt, and at the same time, bankers earned double or triple the interest rate at which it was borrowed. They pocketed billions under the scheme. Wall Street banks also bought high-grade corporate and junk bonds, and emerging market bonds, to fatten their profit margins. At the end of the day, QE-1 was utilized to recoup the gambling losses of the financial aristocracy, and created fertile conditions for driving-up equity markets.

    Here is what Mr Richard Russell, a famous Dow Theorist think of this market-

    Let’s be honest, this is a damnably difficult market. My PTI has been wobbling up and down ever since February. Nothing the markets are doing seem to make sense. C’mon, all I ask for is some clear and obvious trends, and none of the markets seem willing to give me definitive trends.

    So if you’re losing money in the markets (and almost everyone is) don’t get depressed or discouraged. Even the pros are getting beat up by these markets. The winners are those individuals who are losing the least.

    For my own interest, I often follow the selections of well-known advisories. I have six lists that I follow, and all six are now under water. Pity their poor subscribers.

    But if you think you can still win this market just because you think you are smarter than those banks, read this wonderful article from NY Times “A Secretive Banking Elite Rules Trading in Derivatives” ; These are indeed interesting times. Let me add little more to the bearish  tones, Read “warning”, yes warning from John Hussman of “Hussman Funds.

    Just like an advertiser/marketer, presenting data is something that is biased by the author’s perspective. One may choose all the data that points to bearish tone, or data that points to Bullish tone. Whichever case I want my readers to read, I can present data to support that hypothesis.  So keep in mind that just as I can collect data for bearishness, I can collect for Bullishness too.

    But I am NOT Bullish and hence I presented above data.

    Sometime back, I argued Uncle Ben’s logics for QE2; and mentioned that “Permanent Wealth effect via Stock market” logic was flawed. Since then Yields (long term rates) had been going up and up (instead of going down that Mr Bernanke was expecting). So much for the $100 billions that has been spent in the first round of QE2.

    So, bottom-line, where does this all leave a retail small investor? What to make out of all this?

    Here are my three cents. Money is made two ways-

    1. Capital Appreciation
    2. Cash Flow

    To win in the game #1 i.e. Capital appreciation, one needs to have an edge. That edges comes from knowing “How to Value”, then “Finding the Value” and finally “Harvesting the Value”. It takes time and guts. I know of many “long term value investors” who lost their shirts by “buying and holding” thinking that they are buying value. And let’s face the truth, value is not found easily. People of my age haven’t really seen the value in stock markets i.e. when S&P is trading at >6-7% dividend yield and smoothened P/E in single digits. For retail investor, knowledge horizon is limited to the “published” information, and finally he hardly has any influence to change board’s decision to unearth value.

    Sometimes, you may win in #1 by technical/ momentum investing. I’ll leave this to discuss some other day. You may also win when you are investing in a cycle or happen to be in the right place due to factors that you may not replicate i.e. rising tide lifting all the boats.

    Game#2 i.e. Cash Flow Investing involves a different mind set. It is about collecting monthly checks, somewhat similar to monthly salary. You buy a house, rent it and collect the income. It is not a get rich quick scheme. It requires operating discipline and planning. When reviewed over a long horizon (10-20 years) there are many more examples of retail investors succeeding this way vs. those winning via “Capital appreciation”. And that’s where Option Trading comes in.

    Options provide tools and mechanism to retail investor to win the investment game as long as “Greed” and “Fear” is checked and operating discipline is followed. You can design n number of monthly income trading strategies depending upon your knowledge and capital level. Albeit, it has to be a business and be treated like a business. Just like in any business you’ll have Standard Operating Procedure (SOP) or CBAs, you need to have your SOPs/CBAs for your little “Option Trading Business”. Will you win all the months, no! No one can! But do you have more chances of succeeding via Option Trading as opposed to direct equity trading, probably yes.

    So change you game for 2011. Don’t fall victim to the “get-rich-quick schemes”. Set your trading vision. Design your objectives and set realistic goals. Measure those regularly. Learn continuously, refine and then re-set your objectives. If you need help, do drop me an e-mail and I shall help you.

    The New normal is settling-in and you need to prepare accordingly. THERE ARE NO SHORT CUTS.

    Have a wonderful “preparation” for the 2011, don’t spend just because you are “consumer”; every single cent you spend should add value to your life and that’s what is “new normal”,

    OPNewsletter Dec 2010 portfolio is up >10%, if you would like to sign-up, pls click here to sign-up for the wait list as subscription is via invitation only.

    Profitable Trading, OP

  • OPNewsletter Dec’10 Up +13%

    An excellent week for OPNewsletter members. Overall we are up +13.% on a maximum investment of 34.1% of overall 10K portfolio. These results don’t include P&L of speculative trades as those were not part of OPN income portfolios. Since I posted NFLX free trade idea, NLFX has dropped almost $20!! Read the post to know where the next opportunity might be. Since my sharing of Gold on Sept 2, Gold is up over $150/ounce.

    As you may know, recently at OP we have been trading cautiously given macro economic environment and the risks in the markets. Though the clear cut mentality of crowd has been “Buy the dip” not matter what, just “buy the dip” but that’s a dangerous game unless you are day trading and can monitor market continuously (for example $0.30 would have converted into $4.00 by the end of the day if you held PCLN 410 weekly call on Friday, but continued to watch like a hawk throughout the day).

    As the new year begins, expect some interesting offerings coming your way. Also expect some tools that might help you in taking your trading to the next level. Let Mr Market dance whichever step/style, we’ll continue to play our game.  In just a few months, a new and interesting earning season will be kicking-in, ensure you are fully geared-up.

    In addition to consistent income, OPNewsletter also helps you in reducing your brokerage commissions via preferential rates for OPNewsletter subscribers at the top US options brokerage houses. If you are not yet a member of OPNewsletter, you may want to join now. If you would like to read customer testimonial before signing-up, you may read customer feedback here.

    Profitable Trading, OP

  • How to Play Google (GOOG) Earnings

    How to play Google (GOOG) earnings and how to benefit from Implied volatility crush post google earnings is on the minds on almost every option traders I have met or spoken to. But before I proceed further let me share that earnings are usually 50/50 at best i.e. in-spite of complete detailed research you may still end-up being wrong. The chances of win are 50%. If you go with that assumption and are willing to take increased risks for potential windfalls, Google (GOOG) Certainly offers great opportunities for option traders.

    I have been covering Google earnings for almost 4 years. I also provided 4 different option trading strategies on how to play google earnings. For additional reference, LiveVol has done has done an excellent job on explaining past earings and Google’s move post earnings. You may want to check that out as well.

    So let’s begin the current journey. Let’s first look at the IV skew; There is almost 40+% IV skew between Oct and Nov options most of which will narrow by tomorrow (Chart is from LiveVol.com). So a simple inclination will be to sell the expensive IV and buy the cheaper IVs. That’s a good conclusion except that is not without its own risk. Here are a couple of options that you might look into playing (Ref- GOOG last traded price was $543.3)

    1. Buy straight call or straight put. Based on recent past history you may conclude that Google (GOOG) tends to move say $20. So you may want to buy Straight Out of the Money (OOM) Oct 560 calls or 520 Puts. Last mid quote for 560 call was $5.00, and for 520 put, it was $3.00 either google needs to be above $565 or below $517 before you can make money if you purchased straight calls or puts. But here you are assuming a directional as well as movement risk.
    2. You may choose to buy a strangle i.e. Google (GOOG) Oct 560 call AND Oct 520 Put, thus costing $8.00 combined. In this case google needs to be above $568 or below $512 before you can make money. But at least you are not taking any directional risk.

    I personally wouldn’t want to take #1 and #2 options. If I were to choose, I might then choose even further OOM and that too as lottery ticket assuming 100% capital loss upfront.

    So How can one increase chances of success while still hoping for good yield from Google earnings move. Here are few more examples.

    • Sell Google (GOOG) ATM Oct 540 straddle i.e. Sell Oct 540 Call and Puts, as of the market close yesterday it was $22.65/spread i.e. you will receive $2,265 credit but need to keep about $11,000 for margins. This trade will make money if Google is in between $517.4 and $562.6. The maximum gains are equivalent to the credit you received and if GOOG is pinned at 540 on Friday. Expected yield is 2265/10,900= 21%; the risk is that you might lose all the margins if GOOG moves wildly beyond the break-even points.

    • Well you may think that you don’t like above risk reward, but you still think that Oct ATM is pricing the Google move appropriately and hence would like to keep the same break evens but with a better yield. So how about selling an Iron Condor say Google (GOOG) 560/570 Bear Call spread and 520/510 Bull Put Spread. This will generate $367 credit on a $633 margin thus yielding 58% gains assuming Google remains between 520 and 560. The Breakevens are $516.3 and $563.6. The max loss will be if google is below 510 or above 570. Certainly a better option than #1.

    • Still don’t like the yield but willing to trade-off risk for even better yield. Other ways to play is that you can choose 10 points Butterflies with the mid strike at 540, 530 or 550 depending upon your outlook. Butterflies offer fantastic yield but then Google has to settle within that zone. Here is an example of GOOG $570 Call Butterfly (You may check out past examples here).
      • Buy +1 GOOG Oct 560 call and
      • Sell -2 GOOG Oct 570 Call and
      • Buy +1 GOOG Oct 580 Call

    Google Oct 570 Butterfly

    This can be done for only $83. If GOOG is pinned at 570, this trade will yield $917 that’s almost 1,100% returns. This trade will still make money if google is in between ~561 and 579. The risk is, you will lose 100% of the capital if google is beyond these breakeven points.

    • A little more advance option will be to combine a butterfly with either straddle or Iron Condor. That will result in better gains assuming you are right-on for the ATM strike. But even if you are not then remaining Straddle or condor can still make money.
    • These are just some of the examples how Google earnings can be played. Others include Calendars, Double Diagonals, Backspreads and ratio spreads and many more.
    • If however, you are willing to spend time and make even more educated guess, then don’t forget to check out these articles

    If you are not an OPNewsletter member and would like to sign-up, pls click here to sign-up for the waitlist as OPNewsletter subscription is open via invitation only.

    Happy Googling and wish you all the best

    Disclaimer– This post is for information purpose only. Please do your due diligence before investing even a single dollar based on any of the contents on this site including this article.

  • Where are Markets Heading?

    No one has an answer to this question. In August, the market fell nearly 5%, as rising fears of a double dip and of a repeat of 1930s-style deflation, spooked investors and sparked heavy selling. But instead of a continued negativity in September — historically the worst month for stocks — it turned out to be a record September in over 70 years as S&P  jumped almost 9%.  And while markets were rallying in Sept, VIX, remained almost flat (25-23 range). Talk about “unusual uncertain” times!

    To take advantage of intrad day movements and to keep OP readers updated real time, I have been using Twitter/InvesCafe. I am glad to share that some of OP followers have been able to reap nice benefits. It is FREE, check out my profile on InvesCafe and you may review past short term speculative trades as well. You may want to follow my real-time updates for free trade ideas, market outlook and commentary. This will be now even be more useful than ever, as earnings season kicks-in from today.

    So has anything changed in Markets significantly? Nope. Some industry veterans gone to the extent saying that US won’t even recognize itself by the end of year; while others saying Dow going below 1,000. As I have been mentioning for several months now, nothing significant will happen unless markets break-out from the trading range i.e. 1,230 and 1,000 for the S&P500. A 3 years chart below shows you the zone markets have been trading almost for a year.

    S&P 500 Daily Chart

    While 200 points may seem like a lot, we also saw markets dropping by a significantly amount from the Oct 2007 top. Unless either point of this range is broken, the “unusual uncertain” market will continue and a “Trading in the Zone” isn’t unusual for the stock markets.

    A few days back I mentioned The Gartley 222 Pattern and shared patterns to watch for both Dow and S&P500. Both S&P and Dow are pretty much following that scripted story. Now let me share a few more concerns I have currently-

    • The On Balance volume (OBV) is diverging from the price. Now this is not something I will be panicked about and start shorting the markets, but an observation that I would like to keep in mind as I am making my investment decisions. The divergence is not a usual occurrence. See below for price and OBV diversion.

    • Currency wars seems to be on the horizon. All the talks are fine, but guess what? When it comes to protecting jobs/economy of an export driven economy, governments can start to make tough calls. Japan and others have recently intervened. Trillions has been spent to grow the economies since the current meltdown started. So few hundred billions can surely be spent to save it further; especially when “printing press” may not even require the “ink”. And I wonder, why will fed stop pumping money if others are OK to buy “dollars”. The next steps are remains to be seen but Gold is already sensing nervousness and is making new highs.
    • Typically financials shows ledership when economies start to either deteriorate or improve. Look at the Dow Jones Financial Index and SPX ratio, it is falling. We observed pretty much the same before 2007 collapse started. The ratio is continuously declining since Apr 2010.

    • I have already mentioned my thoughts about ISM and manufacturing slow down. The picture will become clearer in a few weeks time.

    Bottomline– Trends takes time to develop and above represents just a few of many things forming macro perspectives. There is lot more that goes into financial markets which we usually come to know, if at all, only after it has happened. This doesn’t mean markets will tumble tomorrow and this also doesn’t mean that I am a bear and shorting the markets. I have my opinions but I love making money from markets. So, I shall continue to trade options as usual but I would avoid going long on equity at least till the elections are over.

    Trade Profitably, Trade Carefully, OP