What a powerful reversal/follow-through for the US markets especially within a week of a 90% down day! Yesterday was a 90% up volume day when a powerful rally in S&P500 was joined by Dow Industrial (DJI), Dow Transports (DJT), Russell 2000 (RUT) and Nasdaq-100 (NDX). Nasdaq cleared 3,000 level for the first time ever since Mar 2000 top. The rally was supported by over 5% drop in VIX cash index (VIX), VIX futures, rise in yield across the board, above average volume and also CBOE 3 month volatility dropped by roughly 6%. There were 4.4 advancing issue on NYSE for every declining issue.
CBOE VIX Skew index (SKEW) dropped by 13%, 2nd consecutive day of more than 10% move. The volatility based indicator already gave a buy signal that I shared before markets opened yesterday. Though divergences are still present in various market internals, during the past few days most of the market internal indicators are moving in tandem with the price action.
Bottom-line– As I mentioned in my late Feb post that if S&P can stay above 1376-1382 area, my bias will switch from bearish to bullish (while still being partially hedged). After this technical breakout yesterday, it seems clear that there is room to go up to 1450/1460 without much of trouble. As a trader, always keep an eye for any breakdowns though, especially for any close below 1370-1376 for S&P500.
Apple Computers (AAPL) is set to announce, most likely, iPad3 during most anticipated event of the year so far. Almost every mainstream media site has a story to write about Apple computers. Apple fans start forming queues in front of the stores often days in advance, almost in every country around the world. It is every marketer’s dream and almost every designer’s inspiration. Apple supports a huge parallel economy that sustains by serving apple fans/users in terms or apps, stores, accessories, etc.
10 years ago on Mar 6′ 2002, AAPL’s price closed at $12.04 or equivalent to ~$11.2 billion market cap; roughly 60% of where NOKIA (NOK) is today or slightly less than 2x of Research in Motion (RIMM) today. And 10 years on, AAPL is a phenomenon!!! Almost at $500 Billions market cap and with almost $100 billions in cash, Apple is an incredible story of our times, a real turn around story, a real game changer. Whether you like Apple or not, only 56 countries in the world has GDPs larger that Apple’s last report annual sales. At about 15 P/E, priced roughly same valuation as S&P500, more than 200 hedge funds have invested into the company. AAPL is the market today and it occupies most of the space in any index it is part of.
iAdmire Apple as a company of what it has achieved financially. Albeit, I am not necessarily an investor in iProducts. A cautionary note to my readers, before Apple, 5 other companies (that I can recall) have hit $500 billion cap mark and those were MSFT, GE, INTC, CSCO and XOM, we know where are those trading today and time that has passed since those peaks. Also those were almost near or just before the market pullbacks. I wish all the best to Apple and hopefully it will defy stock market history like it has done in the past in other areas.
For our option trading, we’ll trade the event and announcement as in the past.
Markets are rallying, but then why and who is buying those S&P500 puts? Why is there such a steep premium between VIX Cash Index and VIX Future prices. The Spread is at the widest. The CBOE Skew Index is in the top quartile, Credit Suisse Fear Barometer (CSFB Fear Index) is at record levels. If everything is rosy, then why such bearishness?
To explore more, On Friday I was discussing with Bill Luby author of Vix And More (An educational interview with Bill) about the steep premium that is reflected in the VIX future prices. The discussion also involved how and what kind of option trading strategies we could use to benefit from such an environment. The discussion pointed me to an article written by Mr Lawrence McMillan in Aug 2010. I shall strongly encourage you to read that article (Here is the original article) by Lawrence who is one of the original thought leaders of option trading world.
McMillan observed that On Jul 20, 2010, the largest premium spread between VIX Cash Index and VIX Futures was about 9 point and such a steep premium comes towards the end of a rally. He also provided some historical references-
There is some precedent for this. Note that the current differential between VIX and the highest futures price is about 9 points. That’s the highest/steepest on record (there were bigger futures discounts in the fall of 2008, but there have never been larger futures premiums). Two other times this year, the term structure became very steep. The first was in mid-January, when the differential between VIX and the highest futures price reached about 7 points. A severe market decline of 100 SPX points (intraday) followed very quickly thereafter. The second was in late April, when the differential reached 8 points at its steepest. SPX soon followed with a drop of 180 points.
It’s no secret what happened in late July/Aug 2010, S&P500 quickly dropped by almost 350 points.
Current VIX future premium over VIX cash index are one of the largest seen in the history. Even higher than what was present during Jul 2010. On July 20, the highest spread was between Jan 2011 and VIX and it was 9.02. As of Yesterday close, the highest premium spread between VIX Cash index and VIX futures is +11.56 for Oct 2012 and onwards. Pls see attached Chart for the VIX Futures premium. Actually it is almost 2.0 points lower vs. what I shared with OPNewsletter members on Friday Feb 24, 2012 when the largest spread was +13.7!!!
VIX Cash Index vs VIX Future Prices
Naturally such a high level of fear is reflected in the Credit Suisse Fear Barometer (CSFB) which is currently at 5 year high. Those who don’t know what is Credit Suisse Fear Barometer is here is the description- The CS Fear Barometer measures investor sentiment for 3-month investment horizons by pricing a zero-cost collar. The collar is implemented by the selling of a 10% OTM SPX call option and using the proceeds to buy an OTM put. The CSFB level represents how far out-of-the-money that SPX put is. The higher the CSFB level, the greater the fear.
Credit Suisse Fear Barometer at Record High
How could you take advantage of such scenario- One less speculative, hedged strategy that Mc Millan suggested was to buy VIX Puts/ Buy SPY Puts. At that time, suggested ratio for 5:3 respectively but you may choose different ratio based on your profile/ volatility analysis. For OPNewsletter members, we are using different Option Trading Strategy which has less risk if VIX stays where it is, but gains significantly if VIX spikes sharply. Keep in mind though that no one can time the markets and thus till the time VIX is not going anywhere, the premium may remain elevated and theta may eat into your gains. So keep a close eye.
You may choose ignore current market scenario and be a contrarian assuming that when such levels of bearishness exist, it’s bullish. However, I am not bullish camp and will not be bullish unless SPX can clear 1376/1385 zones. SPY again gapped down roughly 0.5% at the open but recovered to close at a 52-week high (it’s now > 5times), and VIX has been rising. This is usually not associated with great performance going forward.
Making predictions is a risky business. As a market participant, the best one can do is to make forecast and assign probabilities. Since my last post, markets have been grinding higher but the pace is slowing down. Nothing significant has been achieved on big picture basis. At times, I think it’s Greece that’s keeping markets alive; because at one point, the deal is done only to find that it mean nothing much the next day, but by then markets have already moved on. The again, after some pause, there is a deal which again falters the next day and this “deals is, deal isn’t” story has been continuing for the past 2 years. And in between “the deal is, the deal isn’t” is the “timing” of news which makes it difficult to trade markets. Those who day trade know what I mean.
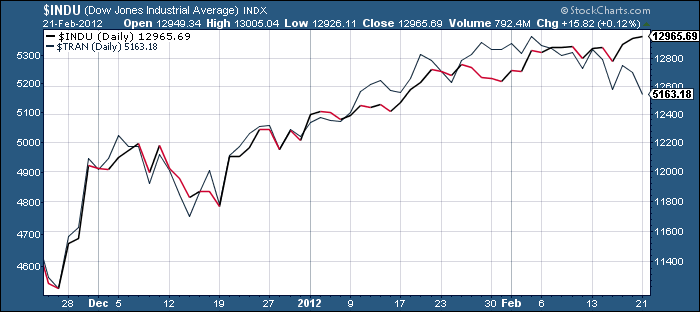
Moving on to US markets. S&P500 hit 1367.76 yesterday; the cracks are already appearing beneath the surface. Almost every key analytical tool that I use is flashing “get out”, at least for short term. Be it old theories like Dow Theory or Modern volatility based indicators, all are saying “exit” (based on the way I use them). Having said that, forecasting right and being right on time are two separate things, especially for an option trader. As an option trader, you may forecast right but if you are off time, Mr theta will come and take away his share slowly.
Divergence in Industrial and Transports
Internals aren’t great either, the A/D line is diverging with price action in S&P 500 and New highs topped on Feb 3rd (at least for now). Dow has already hit almost 100% gains since Mar 2009 lows. What does all this mean to me? The “probability” of going higher is lower vs probability of markets going lower. If S&P can clear 1375 and stay there, then all of the above analysis will be void.
So for whatever worth it might be, I will suggest booking profits (if you were riding the trend) and wait for a better entry to re-enter the markets. 2012 will be an interesting year.
 CBOE VIX Skew index (SKEW) dropped by 13%, 2nd consecutive day of more than 10% move. The volatility based indicator already gave a buy signal that I shared before markets opened yesterday. Though divergences are still present in various market internals, during the past few days most of the market internal indicators are moving in tandem with the price action.