Tag: Bear market signal

  • Just What I Said

    What a week that it was!! It’s very easy to say “just what I said” and pat your shoulder but the tough part is to say now what’s next? How do I benefit from what’s coming? I shall share what I mentioned to OPNewsletter members last week–

    So fireworks happened in the afternoon trading…
    …today is a critical day. Usually after such a sell-off we should be expecting a rebound for 2-7 days but it doesn’t look like the case based on market futures. If Dow can’t hold on to the recent lows, I think 9,400 (+/- 50 or so) will reach quicker then many can imagine, S&P roughly to 1,000 to 975, NDX towards 1650..no one can forecast markets accurately…hence no predictions, a simple game of probability…..pls don’t share this outside this group.

    Dow swiftly moved towards 9,600 before bouncing on last Friday. And what a market action it was on Friday afternoon.  Let me summarize in a simple way; hope zone (first 15mins), pain zone & sluggish zone (almost 3 hrs), then hope zone (2hrs and 45 mins) and finally, during last 12 mins, Dow dropped almost 70 points from the peak. Talk about Wall Street.

    Market internals point to a bearish situation but in the short term markets are oversold.

    • Over 60% of stocks are in bearish zone
    • More than 65% NYSE stocks are trading below 200 day average
    • Almost 85% NYSE stocks are trading below 50days moving average
    • We had 3 90% down days and last week was full of down volume, everyday.

    If there is a technical rebound, the levels that were earlier support will now turn into preliminary resistance areas. As I mentioned on my twitter streams sometimes back that even though VIX closed at 30.12, all the forward months are pricing VIX to be above 33 and that includes month’s as far as Feb’11 so traders are expecting volatility to stay here. Interesting times ahead.

    China’s stock market is already in bear zone. Most eyes are watching now on China’s property market (other one being IPO of China Agriculture Bank, the largest in the world). Others Asian countries aren’t far behind either as prices are running high towards the peak levels. If US is potentially entering into double dip and Euro zone being in austerity zone, export driven Asia economies are going to find it hard to keep growing that doesn’t spell so well for the short term future. According to latest Bloomberg report, China’s property market is beginning a “collapse” that will hit the nation’s banking system, said Kenneth Rogoff, the Harvard University professor and former chief economist of the International Monetary Fund.

    The world is choked with debt. Trillons of dollar has already been pumped to save economies. Just for perspective, 1 Dollar bill is 0.010922cm thick. So if you stack, a dollar bill on top of each other, $1Trillion is about 109, 220 Km in height, almost 1/4th distance to moon. Currently US has over $13trillion nation debt (almost $43,000/person or roughly about $2,000 per person on this planet) almost good enough stack two trips between moon and earth.  That’s only US, here is a list of countries with external debt. The figures are simply mind blowing. These are unprecedented times.

    I am not sure where I read this first, but someone wise said this – “In Bear markets, winner is the one who loses the least”. Bear markets would like to engage as many traders as possible and when bear prowls it is ruthless. An important pattern has completed, there are lots of supports/resistances and we’ll handle it as it comes along. For the time being, I am watching the next level of supports as I mentioned above.

    Our speculative trade on NDX is yielding over +400%, though I have already suggested OPN members, who took this trade, to book profits last week. We have replaced this trade with another high risk/high reward NDX trade.

    Stay in touch, I will be sharing a powerful option trading strategy that can make money regardless the market direction but as long as it moves.

    Profitable Trading, OP

  • This Time is Different?

    In order to share current market conditions, I borrowed this title from an excellent book “This Time Is Different: Eight Centuries of Financial Folly by Kenneth Rogoff and Carmen M Reinhart”. If you haven’t read it, I shall suggest that you get a copy and read it.

    Let’s get to the business. If by June 30th, Dow can’t close above 10,130 this will be the 2nd consecutive month of downward move by Dow for the first time since March’09 bottom. Well, so what?

    Before recent pullback begun, I drew a chart on NDX (Nasdaq-100). In this chart I drew a “potential” head & shoulder top pattern expecting NDX to move upto 1929 and then start to retrace (If right shoulder were to develop) and potentially touch Feb low before or by July 2010. I also shared a modified version of this chart with OPNewsletter subscriber on June 22. Well, so far NDX has retraced almost 100 points and one of our speculative trade (NDX Jul 1700/1750/1800 Put butterfly has yielded roughly +100%). The chart below was drawn after June 16th close.

    The point is not about blowing my own trumpet to say our trade worked out fine, but to share with you about a potential dangerous situation that might be developing in the markets.

    There was a head & shoulder pattern in May-Jul last year spanning across 2.5 months covering about 600 Dow points. The support level was around 8,240 for Dow. It broke the floor but it turned out to be a “fake” H&S breakout (hindsight bias). We have another H&S pattern developing now. You may argue, so what, the current one may turn out to be the same?

    Let’s compare the two-

    • Current H&S pattern spans across almost 6 months (all marked on the chart below) and covers a massive range of almost 1500 points from the peak to the lowest point!!

    • The comparison falls pale when compared with extreme action days (90% volume days either up or down). In last two months alone, I have observed 16 extreme days that include 10 up and 6 downs days (including 2 recent 90% down days on June 22 and June 24th), the most in past 3 years.

    • Monthly stochastic is in the overbought region, and falling and about to cross to trigger a sell signal, as opposed to rising from the oversold region during the last pattern. MACD is showing pretty much the same picture.
    • On the economic front, last year we were expecting positive news 6-9months later as opposed to double dip/Euro crisis currently and every light at the end of tunnel seems to be another locomotive.
    • Last May-Jul, China was not in a bear market zone [If you didn’t know, China is already grappling with Bear (as defined by 20% or more decline from peak) and is below the level seen last July]

    I don’t think there is anything else to forecast or write about except that we need to be careful. You might have noticed my cautionary tone beginning Mid April when I started saying that market requires caution and Little Johnny’s are coming to the market who are usually late comers to the party.

    Neither I am not a doom’s day forecaster nor a euphoric optimistic. No hard rain is coming until unless all major indices fall and close below Feb lows. I am glad that I have suggested OPN subscribers to be out of stocks when Dow dropped below 10.3 for first time (or check my twitter streams).

    Bottomline –It’s your money. Take care and trade carefully. There is no need to take unnecessary risk. When bear attacks, panic reigns, screen freezes, decision making chokes. Financial freedom is not about being invested all the time or just buy and hold (at least I don’t think that way). Cash has it own wonderful returns that allows to buy when things are cheap. Check here what does financial freedom means. Let Mr Market do the talking and show the way. I am still watching the Feb lows before concluding anything else.

  • Is the Correction Over?

    Is this correction over? Probably a trillion dollar question that is going through everybody’s mind! The irony is that whoever has the crystal ball to answer this, probably doesn’t even need to answer this as he/she must have already achieved the market nirvana. Rest of us can only try or guess.

    Let me share my two cents on where we are.

    First, if we assume that stock market is a leading indicator, then it is already projecting tough economic environment ahead. Does that mean are we going to see a double dip recession? Here is what one of my favorite analysts, John Hussman, thinks. (Below is just a snapshot, I shall encourage you to read more by clicking here)-

    The following is our refined set of “Aunt Minnie” criteria for identifying oncoming recessions. See the November 12, 2007 comment Expecting a Recession for details. In every instance we’ve observed these conditions, the U.S. economy has either already been in a recession, or has been within a few weeks of what turned out in hindsight to be the official beginning of a recession. There have been no false signals.

    1. Widening credit spreads: An increase over the past 6 months in either the spread between commercial paper and 3-month Treasury yields, or between the Dow Corporate Bond Index yield and 10-year Treasury yields. This criterion is currently in place.
    2. Moderate or flat yield curve: A yield spread between the 10-year Treasury yield and the 3-month Treasury yield of anything less than 3.1%. As of last week, the 10-year Treasury yield was 3.22%. The 3-month Treasury bill yield was 0.08%. So virtually any decline in the 10-year yield from here will put this criterion in place.
    3. Falling stock prices: S&P 500 below its level of 6 months earlier. This is not terribly unusual by itself, which is why people say that market declines have called 11 of the past 6 recessions, but falling stock prices are very important as part of the broader syndrome. This criterion is currently in place.
    4. Moderating ISM and employment growth: Manufacturing PMI (at or) below 54, coupled with either total nonfarm employment growth below 1.3% over the preceding year (this is a figure that Marty Zweig noted in a Barron’s piece years ago), or an unemployment rate up 0.4% or more from its 12-month low. At present, both of the employment measures are in place. Last month, the ISM PMI dropped from 60.4 to 59.7.

    For all intents and purposes, unless the credit spreads, the S&P 500, or the yield curve reverse, a further decline in the Purchasing Managers Index to 54 or below would be sufficient to confirm a “double-dip recession.” Note that by itself, such a level might not be particularly troublesome. But in concert with the other evidence we observe, it would be sufficient to complete the syndrome of risk factors.

    So if I were to draw my conclusions then probability of double dip is more than “no 2nd dip”. For skeptics, the answer maybe, this might be just another one of those 10% corrections which typically occurs in a bull market. Well, maybe not so this time especially when you read this–

    According to Bespoke Investment Group, there have been 58 “corrections” of 10% or more in the Standard & Poor’s 500 since 1927. In 33 cases, the corrections stopped short of the 20% bear market threshold and the market went on to higher highs, while 25 times they grew into a full-grown grizzly.
    But in the 32 instances when the market has dropped as much as this one has the outcome has been heavily weighted to the losing side. Only seven times drops of that size stopped short of the 20% bear mark. In the 25 other times the decline extended to 20%, the average bear market decline was 35.5%.
    Over a period of time, I have observed that stock market is about probability and then risk management to adjust to those probabilities.

    Since Apr 26th top (Assuming it was) we have observed thirteen 90% volume days. It is the most number of 90% days (for a similar period) since the Mar’09 uptrend begun. It had total of 8 90% down days and 5 90% up days. The severity of extreme action clearly shows that this correction is different from the previous corrections of this uptrend.

    Dow DWM June 14 2010

    On daily charts, MACD, Stochastic and my breadth indicators are pointing upwards more so because of a technical oversold state. However, don’t forget monthly and weekly pictures. It is not oversold on a weekly basis and if June turns out to be a down month, then monthly stochastic will probably trigger a sell signal.

    Bottomline – The coming week is going to be an interesting one as markets halted their advances near short term resistance levels. As I have been sharing for a while, pls be careful and don’t over trade. At best, market action is mixed with one thing relatively obvious. The upside is not great here, downside is; so be on guard for your capital. Bullish, Bearish everything is in the hindsight (except in the extreme cases); the “reality” and the “present” is “trading capital”. If there is no capital, both bull and bear are useless. So read whichever news source you like, conclude whatever you like but one thing is sure, before sky falls, markets have to close below Feb lows.

    Trade Carefully, Trade Profitably,
    OP

  • Is It the Beginning of a New Bull Market?

    It’s been quite a while since I last posted and since then a lot has occurred in the markets. Just to provide the context before proceeding, since we opened Aug OPNewsletter portfolio 2wks back , hold your breath, X is up almost +25%, OIH +14%, IWM /RUT +11%, GDX and Dow +9%, S&P500 almost +8%. What a spectacular bull run over bearish bias we had for OPNewsletter. These are fairly large move, in such a short span, from historical standards.

    And guess what, Bulls have been charging up and away without any resistance from Bears, day after day. The market behavior seems to change. Stock markets moves higher during the last hours as opposed to diving deeper in red the last hour. Such an interesting phenomenon, in an overbought condition, represents the strength of the market. It really doesn’t matter to market participants that such a thing has been happening without any volume sponsorship and internals (as measure by Lowry’s) are not at their best level as represented by price action of the markets.

    • Bullish side of the coin – Markets have been moving higher in spite of overbought conditions. The bull market signals from Coppock curve and Dow Theory must have converted even one of the most conservative investors to turn Bullish now.
    • The Bearish side of the coin- The markets are overbought and a short-term pull back is overdue.  Based on Demand and Supply, even a single day of ample sell-off can drive shivers in the markets.

    Over the last few days there are two interesting quotes that I came across which pretty much define the whole move from March lows to current high in a simple yet powerful way-

    This one is from Lowry’s-

    An old factoid says that the most learned scientists and aerodynamic experts have concluded that it is impossible for a bumblebee to fly. But, the bumblebee does not know that he cannot fly, so he just keeps buzzing along. Similarly, despite our evidence that the rally from the March’09 market low has not conformed to the normal characteristics of a new bull market, the major price indexes have just kept advancing to new rally highs. The difference is scientists are dealing with absolutes, while the stock market deals with probabilities.

    Another one from latest weekly update from John Hussman-

    That said, I can only describe our investment stance here as “uncomfortably defensive.” That is, the measures that have guided the performance of the Strategic Growth Fund over time are still holding to a defensive stance, which is admittedly uncomfortable with the market pressing strenuous but persistent overbought levels. It’s a lot like watching people scale across a tenuously secured rope bridge and get a nice meal at the center. You’d like to climb across and join them, but you know that too many things aren’t right with the bridge, and it’s not clear that the people who are eating will ultimately survive.

    Whatever your take on the markets us, this run in the markets since March 9 low has proven “If something doesn’t happen, doesn’t mean it can’t happen. It’s just that the data till date is not sufficient to prove its occurrence” (this is not my quote; I can’t recall where I read that).

    Analysts have been increasing earnings estimates left, right and centre. (Btw, do these guys really know anything that helps retail investors? Where were they in 2007 early 2007 when Subprime was about to bring financial Tsunami? Where were those “early warning system” to help guide investors? what about just 4 months back when Markets were to register one of the most powerful rally? The famous excuse “We change as new data emerge”- a convincing one ).

    Bottomline- I want to be bullish, but don’t want to be overly bullish. I am still looking for margin of safety. I shared a trade idea for long term with OPNewsletter members and will share more in the coming days. The most I can say is that probably you can treat this as mini bull market (or an extended Bear Market rally) within a set of primary bear market. Near term support for the DJIA appears to be 8900-8800 level, at 945-950 for the S&P 500 and at 1875-1860 for the NASDAQ.

    Trade Carefully, Profitable Trading, OP

  • What’s Next for Stocks Markets and Me

    So we are having a great rally. It doesn’t seem like it wants to pause. If Dow is up this week, it will be up 8 out of the last 9 weeks. Wow, what a complete reversal of a downward trend that we had been observing since last year. What an extended overbought period. The bears, including me, have been waiting for a pause or correction which seems not to take place. The stock markets are currently behaving like a shock absorber and nothing seem to discourage bulls. All well, till it is not.

    A lot of my personal holdings are up sharply over the past few weeks. There is a big margin of safety in those holding but those have risen just too fast that now I am scared of these gains and starting to book profits and probably reenter after a few weeks.

    If you are looking for what some of the prominent thinkers think, here is a good piece of advice from good experienced Richard Russell-

    What to do? I’ve done a lot of thinking on this question, and my conclusion is as follows — hold a fairly large quantity of physical gold (coins), hold cash, hang on to your house, and you might even buy a bargain-priced foreclosed home if you wish — but above all, cut back on unneeded expenses (cut back on coffee, vacations, movies, fast food, and other non-essentials). Cash is for deflation if it continues, gold is insurance against future inflation, a bargain-priced foreclosed home is good value and it’s also a tangible asset.

    That advice is coming from a market veteran who has been observing markets for almost 5 decades and have first hand experienced The Great Depression. Below is what John Hussman thinks? He is one of the value investing fund managers whose market insights I read quite often-

    Are stocks in a bull market or is this still a bear market? Frankly, I don’t put much energy into that question. The S&P 500 has now corrected about one-quarter of its prior losses. Bear market corrections of about one-third are not unusual, but I wouldn’t bank on that. Having failed to do anything effective to mitigate the second wave of foreclosures that is set to begin later this year, and seeing very little sponsorship in trading volume (despite good breadth), my impression is that we most likely are in a strong correcting rally in the context of an ongoing bear market. At the same time, cash-equivalents are yielding next to nothing, so it’s unclear to what extent investors will decide that stocks are their only real alternative, which might allow a continuation of this advance.

    I am not including the bullish perspectives as I am bearishly biased. The internet, every business website, analysts sites and almost all the stock newsletters, are filled with bullish calls from tons of market analysts. Oh btw, do remember, a lot of them never saw the meltdown coming. There are stock upgrades left, right and center. An enthusiasm is on and it seems retail investors are on shopping spree aka bottom fishing.

    What do I think-

    My desire to get into this rally is getting stronger and stronger, at the same time, “hindsight bias” of missing rally, by not investing in bigger way,  is also making it irritating, at times. If it is forcing even myself to think my view again. I take this as a sign of retail public entering into the market (no co-relation and there is no statistical data to prove this). I am being requested by many if I would be willing to manage their money, including those who can’t even spell “stocks” properly (don’t worry they know English well), which I interpret as “trouble ahead”. I think of it as on-going correction in a primary bear market trend that has not run its course yet.

    I have different investment strategies in place. Separate for stocks, another one for Yield and last one for options & futures. These fall into “Stocks and Options” asset classes. Gold etc constitutes other classes.

    I am beginning to book my profits on the stock holdings and collect cash. I wanted a market turn-around but I didn’t want such a quick and violent rally. The returns are generated in such short span vs. a few years time i would expect. The rally is now overextended and I am not going to be opened to Mr. Market’s mood. All indicators say time for a turn, but guess what “Markets can remain irrational longer than I can remain solvent”.

    For Options & Futures, large portion is based on OPNewsletter strategies and I am fully invested there, as per OPN’s objective of about 60-70% investments. This was after a long time and I shall continue to remain invested using OPN strategies. However, depending upon indications of deterioration or accelerations, we might choose to add straight calls and puts. The overall strategy is bearish bias. (Sign-up for the OPN Waitlist here)

    So ladies and gentlemen, all I can say is that it is time to “stay very cautious”, the optimism is running very high, and these are times when everyone else but Buffet and a rare few more is positive, and often that is the time to off-load garbage.

    Choose the strategy that works for you. Don’t give your hard earned money to any “managers” unless they can show you that they deserve it. Ask them for their performance record of past 18months and judge yourself.

    Trade carefully, Trade Profitably

  • Get Ready for Next Bear Leg and Start Hedging

    As of yesterday’s close, the DJIA has gained 21% since establishing the March 9 low. The S&P 500 and NASDAQ have gained 23% and 25%, respectively, over the same time period. Wow, we have had wonderful rally so far, >20% gains in matter of less than 3 weeks; and probably one of the strongest rally that we have seen in this bear market. To make the bullish case even stronger, the rally continues to extend despite overbought conditions showing solid strength.

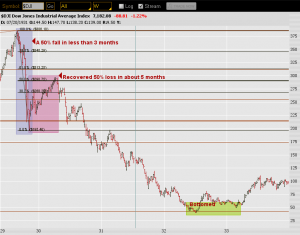
    dow-great-depression-pix-1But, is this short covering or real buying? During great depression, there were almost 8 to 9 rallies depending upon what you consider rally. Market topped out on Sept 3, 1929 @ 386.10 and then it dropped 18% fairly quickly (almost 1 month) and recouped 50% of losses in few sessions. Then it dropped again from 358 to 212 i.e. (60%) in about a month’s time (Mid Oct’29 to Mid Nov’29) and it recouped slightly less than 50% of this fall in next few weeks then there was another correction before indices marched upward to regain 50% of losses from all the way from Sept’29 top. The rally continued till Mid April’30. There so many sharp snap back rallies till Jul 8,32 when Dow bottomed at 40.60 never to see that level again.

    In the current scenario, from a 14,198 top to Mar 9 low 6470 for Dow,  the 50% target will be around 10,334. So there is all likelihood for indices to go those sort of levels in extreme cases before resuming any downward trend assuming the economy continue to deteriorate. But before Dow even touches 50% level, there will be minor resistance at 8,000 followed by strong 8,900-9000 band.

    (more…)