Blog

  • Vertical Spread Strategy Explained

    Vertical Spread Strategy Explained

    Vertical Spreads Strategies are one of the most versatile form of option trading strategies. Some of you by now have become really good at Options Trading using Vertical Spreads for Income. But if you’re still struggling to nail Vertical Spread strategy, or if you’re just getting started in options trading world, this comprehensive article is most definitely for you.

    Let’s kick off the New Year with an absolute game changer in your Options Trading. I’ve put a lot into this article for you, so make sure to read completely and ask questions to get everything you need to start the new year off successfully!

    What is a Vertical Spread?

    In this Vertical Spread focused article, you are going to learn:

    1. What is a Vertical Spread?
    2. Two ways you can structure a Vertical Bull Spread?
    3. 3 Different scenarios (Up, down and sideways) and how to calculate your risk/reward.
    4. Is Vertical Debit Spread better or Vertical Credit Spread?

    Vertical Spread

    Vertical spread is an option spread strategy whereby an option trader purchases a certain number of options and simultaneously sells an equal number of options of the same class, same underlying security, same expiration date, but at a different strike price.

    In Vertical Spread, when one option is making money, the other option is losing money and thus Vertical spreads limit the risk involved but at the same time they reduce the profit potential.

    Vertical Spreads can be either Debit Spread or Credit Spread, and can be created with either all calls or all puts. Vertical Spreads can be bullish or bearish.

    Vertical Spread Starter Guide

    Bull Vertical Spreads

    Bull vertical spread is an options trading strategy designed to profit from a rise in prices of the underlying asset we’re trading. It can be constructed in two ways:

    1. By using Put options – “Bull Put Spread”, a Vertical Credit Spread
    2. By using Call options – “Bull Call Spread”, a Vertical Debit Spread

    When structured for similar strike prices, similar expiration, both Bull Put Spread and Bear Call Spread have similar risk/reward profile. Attached option table below, that shows Apple Inc. (AAPL) Vertical Spreads real-time prices, confirms the same.

    APPL Vertical Spread Option Prices How to read above Option Table:

    1. It is $5 wide vertical spread (the difference between two strikes).
    2. Look at “Mark” column. That is the “mid price” between bid and ask.
    3. Call Options are on the left and Put Options are on the right.
    4. If 100/105 Bull Call Vertical Spread Costs $2.16 to open, it’s maxim profit is $5-$2.16 = $2.84, almost the same as the credit by selling 105/100 Bull Put Spread at $2.87!

    One may choose either of the two of vertical spreads to trade his directional view. However, it is much better to structure a trade based on Bid/ask slippage and Ease of fill. Based on my experience, it is a good idea to structure a Vertical Spread using “out of the money” options for better fills. Using an example let’s review Bullish Vertical Spread first, along with possible outcomes (profit and loss). We will use a hypothetical example on a stock which is currently trading at $48 per share. For our example, let’s assume:

    1. Based on some technical or fundamental analysis, we are bullish on this stock and we expect the price to rise in the next 15 days
    2. Let’s suppose today is January 15th and we decided to go through with our bullish strategy based on our bullish signal.
    3. Expiration date of both our options is Jan 31st.
    4. Stock is currently trading at $48.00 per share.

    Bullish Vertical Spread Using Call Options

    Here is the price chart marked with entries for selecting spread using Call Options:

    Setting up Bull Call Vertical Spread

    Structuring the Bull Call Spread

    1. First, we will buy Call options with a strike price at $50.00, which is trading for $0.50 (for example) per share. Since options come in lots of 100 shares, we would spend $50 for this particular Call option.
    2. Simultaneously, we will sell equal amount of Call options with a higher strike price at $52.50. By selling this call for $0.20 per share (for example), we would receive $20 (100 shares X $0.20).
    3. By setting up two options in this manner, we have constructed (or purchased) a Bull Call Spread and it cost us $30. We paid $50 for the lower strike price Call Option (price at $50.00), while we received $20 by selling the higher strike price Call Option ($52.50).
    4. Since it was a debit i.e. cash outflow to open this spread, it is called a Debit Spread. In this case our Initial Debit is $0.30 per spread (or $0.30 X 100 = $30). Here is the same chart marked with profit/loss areas according to potential price movement by expiration date:

    Bull Call Vertical Spread Setup The price at $50.30 represents our breakeven point, and any price move above that value would result in profit.

    1. If the price stays or closes below our first strike point at $50.00, our loss would always be the same since it is determined (and capped) solely by our initial investment of the spread we purchased. Buying our first call at $50.00 strike price for $50 while selling our second call at 52.50 strike price for $20, our overall cost will be $30 ($50 – $20). We say our Debit Spread cost us $30. Debit amount in bull call spread is the maximum loss amount.
    2. If the price stays above $50.00 strike price, but below $50.30 value, our first long call option is starting to make some money (go in the money) and it will offset our loss caused by our initial investment, finally breaking even at $50.30.
    3. Price moving above $50.30 will increase our profit up to a point when it reaches $52.50, where our short call is placed. That short call option is “capping” our profit, and any price movement above $52.50 will not result in any additional gains. It is the point where our short call option starts to work against us.
    4. As the upper short call is losing money, our lower long call is making money – options are “hedged” against each other. Maximum profit is locked in when price is at or above short call $52.50 strike point – by expiration.

    Here is the visual representation of the risk/reward profile at expiration to explain what we just described above: Vertical Spread Risk Reward Profile Notice the X-Axis i.e. the stock price axis to see how price movement affects our profit/loss. As our purchased call option ($50.00 strike price) is getting “in the money”, our loss is being reduced. Once the price moves above the $50.30 value, we start profiting. That profit increases up to a price of $52.50, where our short option is placed. Notice how a further increase in price (for example it can move to $60 per share) doesn’t affect our maximum profit which is capped at $220. Vice versa, notice what would a potential decrease in stock price to $0 mean for our vertical spread – you’re correct – it doesn’t affect our loss amount.

    [color-box color=” customcolorpicker=” rounded=false dropshadow=false]

    Geek’s Notes: Detailed calculations of the Risk/reward

    Scenario 1: Stock is equal to or above $52.50, let’s say at $57.00

    In this case, we will make maximum gains. The profit will be calculated based on intrinsic values of each option at expiration.

    1. Intrinsic Value of sold Call Option (Stock Price- Strike price), Is = $57.00 – $52.50 = $4.50
    2. Intrinsic Value of purchased Call Option (Stock Price- Strike price), Ip = $57.00 -$50.00 = $7.00
    3. Profit/Loss = Ip –Is – Initial Debit = $7.00 – $4.50 – $0.30 = $2.20

    Since each option controls 100 shares, our gains will be $2.20*100 = $220. That’s +733% gains ($220 / $30 = 733%)

    Scenario 2: Stock is equal or below $50.00, let’s say at $49.00

    In this case, we will make maximum loss. The loss, just like profit, will be calculated based on intrinsic values of each option at expiration.

    1. Intrinsic Value of sold Call Option (Stock Price- Strike price) = $49.00 – $52.50 = $0 (since it can’t have negative value)
    2. Intrinsic Value of purchased Call Option (Stock Price- Strike price) = $49.00 – $50.00 = $0 (since it can’t have negative value)
    3. Profit/Loss = Ip – Is – Initial Debit = $0 – $0 – $0.30 = –$0.30

    Since each option controls 100 shares, our loss will be $0.30*100 = $30. Remember, this value actually represents our initial investment and thus 100% loss.

    Scenario 3: Stock is above $50.00 but below $52.50, let’s say at $51.00

    In this case, profit or loss will again be calculated based on intrinsic values of each option at expiration.

    1. Intrinsic Value of sold Call Option (Stock Price- Strike price), Is = $51.00 – $52.50 = $0 (since it can’t have negative value
    2. Intrinsic Value of purchased Call Option (Stock Price- Strike price), Ip = $51.00 -$50.00 = $1.00
    3. Profit/Loss = Ip – Is – Initial Debit = $1.00 – $0 – $0.30 = $0.70

    Since each option controls 100 shares, our gains will be $0.70*100 = $70. That’s +233% gains ($70 / $30 = 233%) [/color-box]

    Bullish Vertical Spread Using Put Options

    First, we will sell Put option with a higher strike price at $52.50, and simultaneously, we will buy equal amount of Put option with a lower strike price at $50.00. Let’s assume that these two transactions, when combined, gave us $2.20 credit – since options come in lots of 100, our credit received for this bull put spread is $220. We are not allowed to consider this amount as our profit (yet) since it is only initial credit we received for constructing our spread in this manner. Assuming underlying price is in our favor, our profit will accumulate gradually and only materialize on expiration.

    Vertical Spread Starter Guide

    Why sell higher strike and buy lower strike in case of bull put spread?

    It is because we are comparing the risk/reward profile with respect to Bull Call Spread and we are using the same strikes. By setting up two options in this manner, we have constructed (or sold) a Bull Put Spread and we collected $220 credit. Since it gave us credit to open this spread, it is called a Credit Spread. In this case our Initial Credit (Ic) is $2.20 (or $2.20 * 100 = $220) Here is the same chart marked with profit/loss areas according to potential price movement by expiration date: Bull Put Vertical Credit Spread Setup Next, let us show what happens with our profit/loss when a stock price moves in different directions as we are nearing our expiration date.

    1. As soon as price reaches $50.00, our long put option starts to lose money, but simultaneously, our short put option (at strike price of $52.50) is producing profit for us – as stock price moves higher.
    2. Price at $50.30 represents our break even point, after which our profit from this setup starts increasing. It will increase up to a point when price reaches $52.50 – after this point, since both our positions are hedged against each other, the maximum profit will not change. It is capped at $220, the initial credit.

    Here is the visual representation of the risk/reward profile at expiration to explain what we just described above: Vertical Spread Risk Reward Profile [color-box color=” customcolorpicker=” rounded=false dropshadow=false]

    Geek’s Notes: Detailed calculations of the Risk/reward are explained below:

    Scenario 1: Stock is equal to or above $52.50, let’s say at $57.00

    In this case, we’ll make maximum gains. The profit will be calculated based on intrinsic values of each option at expiration.

    1. Intrinsic Value of sold Put Option (Strike Price- Stock price), Is = $52.50 – $57.00 = $0 (since it can’t have negative value)
    2. Intrinsic Value of purchased Put Option (Strike Price- Stock price), Ip = $50.00 – $57.00 = $0 (since it can’t have negative value)
    3. Profit/ Loss = Initial Credit +Ip – Is = $2.20 + $0 – $0 = $2.20

    Since each option controls 100 shares, our gains will be $2.20*100 = $220. That’s +733% gains ($220/$30 = 733%). We get to keep all the credit we collected to open this trade.

    Scenario 2: Stock is equal or below $50.00, let’s say at $49.00

    In this case, we’ll make maximum loss. The loss, just like profit, will be calculated based on intrinsic values of each option at expiration.

    1. Intrinsic Value of sold Put Option (Strike Price- Stock price) = $52.5 – $49.00 = $3.50
    2. Intrinsic Value of purchased Put Option (Strike Price- Stock price) = $50.00 – $49.00 = $1.00
    3. Profit/ Loss = Initial Credit +Ip – Is = $2.20 + $1.00 – $3.50 = –$0.30

    Since each option controls 100 shares, our loss will be $0.30*100 = $30.

    Scenario 3: Stock is above $50.00 but below $52.50, let’s say at $51.00

    In this case, profits or loss will again be calculated based on intrinsic values of each option at expiration.

    1. Intrinsic Value of sold Put Option (Strike Price- Stock price), Is = $52.50 – $51.00 = $1.50
    2. Intrinsic Value of purchased Put Option (Strike Price- Stock price), Ip = $50.00 – $51.00 = $0 (since it can’t have negative value)
    3. Profit/ Loss = Initial Credit + Ip – Is = $2.20 + $0.0- $1.50 = $0.70

    Since each option controls 100 shares, our gains will be $0.70*100 = $70. That’s +233% gains ($70/$30= 233%) [/color-box]

    As you may notice, in both cases, the profit/loss (risk/reward) was same whether you chose Bull Put Spread or Bull Call Spread using the same strikes. However, as mentioned earlier, it is much better to structure a trade based on bid/ask slippage and ease of fill, and thus it will be much better to use Bull Call Vertical Spread vs Bull Put Spread. Out of the Money Calls will be much easier to be filled vs Deep In the Money Puts and bid/ask slippage will also be relatively smaller.

    Vertical Spread Starter Guide

    Be Patient with Yourself

    This post covers only BULLISH VERTICAL SPREADS. In the following post, I will cover BEARISH VERTICAL SPREAD and provide you more examples so you could follow through.

    Finally, I have to remind you to be patient with yourself. This isn’t all going to fall into place tomorrow. My goal is to give you a roadmap and a bunch of examples, so you see where you want to go with your options trading and have the skills to get there day by day.

    How do you like it? What additional thoughts or questions do you have? I will answer every question, no strings attached. Make sure to leave your comments or questions so you can make the most of your learning.

    Profitable Trading, OP

  • Trading FOMC Event Via Bearish Butterfly Spread

    Trading FOMC Event Via Bearish Butterfly Spread

    Arguably, the most important day of the year for the stock markets is right here. In about an hr, FOMC decision on interest rates will be announced. Almost everyone is expecting a 25bps rise!

    Whatever the FOMC decision maybe, there is a speculative Option trade opportunity on either side. Though, I am bearish, the similar strategy can be used for bullish bias as well.

    So in simple terms quickly, here is the trade-

    Buy to Open a Broken Wing Put fly (What is a Butterfly Options Spread) for roughly $0.25 to $0.75 debit. Though it is slightly bigger range than I would ideally suggest, but for a bearish bias, it’s too good to pass. It consists of three options-

    • Buy Dec 2020 Put
    • Sell 2 Dec 200 Put and
    • Buy Dec 1975 put
    • All Dec Monthly Expiration i.e. Expires this Friday

    Here is how risk/reward chart for the trade look like.

    SPX OOM Fly rev

    Here are the mechanics of the trade-

    • Thus for 1 contracts it requires $2585 capital (Assuming $0.85 debit).
    • Maximum risk is $585 (if S&P drops below 1980 by this Friday).
    • I will lose only $85 if SPX remains above 2020 by this Friday.
    • Maximum gains are about $1900+/- if S&P expires at 2000 this Friday (Don’t coun’t on it)
    • IF however, SPX is anywhere between 1980 and 2020, this trade will bring solid gains.

    Never ever violate money allocation principles. Allocate only what you can afford to lose 100%!!

    WARNING: THERE IS A HIGH PROBABILITY THAT THIS TRADE WILL BE A COMPLETE WASHOUT  (Don’t trade it after 1.45pm US Easter time i.e. 15 min before FOMC announcement).

    Profitable Trading, OP

    Disclaimer- This post is for entertainment only. Do your due diligence before investing any money or following this trade. Options are risk and you can lose all your capital in options.

  • What is Options Trading? Top 10 Things You Must Know Before Trading Options

    What is Options Trading? Top 10 Things You Must Know Before Trading Options

    Options Trading can be extremely rewarding. However, it is also a fact that majority of Options traders struggle to make money consistently. Before you begin to trade options, it is crucial to understand basic nature of options and how Options are different from other trading instruments e.g. stocks or forex.

    Here is simple, straight forward TOP10 list that might help you in understanding basic nature of options.

    1. Right to BUY or SELL

    Options give you the right to buy or sell an underlying instrument at specific price. Options are available on a variety of different underlying assets including stocks [e.g. Apple (AAPL), Microsoft (MSFT)], futures (e.g. S&P500 futures commonly known as ES_Mini), Commodities (e.g. Crude Oil, Gold, Wheat), Forex (e.g. JPY, CHF, Euro), Bonds (e.g. 30Year, 10 Years) and indices (e.g. S&P500, Nasdaq, Dow Jones). In fact, the list just keeps on growing.

    Once you have identified the desired market or underlying asset to trade, you may simply check out if that underlying asset has options or not.

    2. ONLY Two Types of Options

    There are only two kinds of Options.

    CALL OPTION

    A call option is an agreement that gives the option buyer the right to buy the underlying asset at a specified price within a specific time period.

    PUT OPTION

    A put option is an option contract giving the owner the right, but not the obligation, to sell a specified amount of an underlying security at a specified price within a specified time frame.

    Bottomline: A Call Option gives you the right to buy the underlying asset and A Put Option gives you the right to sell the underlying asset. Generally speaking, you buy Call Option because you have Bullish Outlook and you buy Put Option when you have bearish outlook.

    Though there are only two types of options, when you factor in other characteristics of options, there are endless trading possibilities.

    3. Each Option has a Symbol

    For instance – Apple is just one stock and its stock symbol is AAPL. However, AAPL may have hundreds of options. So how do you remember? There is proper method for defining symbols. A symbol contains- a) Date of expiration (Year, Month, Date), b) Underlying Asset Symbol, c) Strike Price and d) Option Type i.e. Call or Put.

    An Example – AAPL150821C125 ( Apple Call Option at 125 strike that expires on 21 Aug 2015).

    4. Buying an Option Means, Right

    If you BUY AN OPTION, you are not obligated to buy the underlying instrument; you simply have the right to exercise the option. When you buy a Call Option, you have the right to BUY stocks at your option’s strike price.

    Similarly, when you buy a Put Option, you have the right to SELL stocks at your Option’s price.

    5. Selling an Option Means, Obligation.

    If you SELL a Call Option, you are obligated to deliver the underlying asset at the strike price at which the Call Option was sold if the buyer exercises his or her right to take delivery. If you sell a Put Option, you have to buy the underlying if exercised.

    Generally speaking, if you don’t take any action, your friendly broker will most likely do it for you if your Options are eligible for exercise.

    6.Options are Good only for Specified Time.

    Options are good for a specified period of time after which they expire and the option holder loses the right to buy or sell the underlying instrument at the specified price. This specified period is called “Expiration”.

    Options are available for variety of expiration timings such as weekly, Monthly, Quarterly and much longer durations (known as LEAPs).

    7. The Cost of an Option is Referred to as the Option Premium.

    The price reflects a variety of factors including the option’s volatility, time left until expiration, and the price of the underlying asset. There are several Options Pricing Models that you can use to calculate theoretical Option Price by modeling various parameters.

    There is no fixed price for an Options. It is dynamic and will keep on changing with respect to time to expiration and other variables.

    8. Buy at Your Price, Sell at Your Price

    You can choose any price at which you would like to BUY or SELL underlying instrument. These prices are called Strike Price and Options are available in several Strike Prices at, far or near the current market price of the underlying instrument.

    9. Buying Means, Debit

    Options when BOUGHT are purchased at a DEBIT to the buyer. That is, the money is debited from your brokerage account. It’s exactly like Buying a stock.

    10. Selling Means, Credit

    You can SELL and Option, without owning the shares. Options when SOLD are sold at a CREDIT to the seller. Money is added to the brokerage account. You can’t withdraw this money until the trade has been closed. Usually, this money is used to offset the margin required for selling the options.

    Once you understand the basic differences, key terms of options, don’t jump into trading options yet. Trading options usually requires mindset change and you may want to know the single biggest mistake new option traders make.

    Profitable Trading, OP

  • Don’t Trade Options If…

    Don’t Trade Options If…

    Don’t trade options!

    Yeah, you are reading it right. We at OptionPundit, a premium Option focused website, are telling you not to trade options!! In fact don’t trade stocks, forex or commodities also if you can’t put your heart-n-soul into it to understand how it works and what does it take to succeed in that business. Trading Financial markets isn’t easy and it will never be easy as it directly deals with money and the competition will always be tough. This is even more relevant in case of financial markets as market participants are now even more sophisticated than ever.

    If you can’t afford the time and resources to prepare, persist and persevere, you will be disappointed with Options trading. Let’s dive into the details.

    Options Are From Mars

    Just like one has to understand A, B, C of a language before he could read, write or create beautiful stories, it is important to understand the language of options. At the end of the day, Options are just another trade tools with pros-n-cons.

    Compared to stocks, which is extensively discussed and taught through traditional education system, options’ are not widely known. Most people learn about options after completing traditional education and by that time theoritical understanding of stocks is deeply rooted. It is evident in practical conversations with beginners. Almost everyone understands BUYING A CALL OPTION very easily vs. BUYING A PUT OPTIONS. And the moment, you talk about SELLING A CALL or PUT OPTIONS, the same people start looking around.

    Yes, there are just two type of options CALL OPTIONS and PUT OPTIONS, and yes there are just two transaction BUY and SELL, and yes when compared with stocks, options require much less parameters to understand, still one has to learn the language of options before benefitting from it.

    So if you are not willing to spend time to understand fundamentals of Options, it’s better to stay away from options.

    [color-box color=” customcolorpicker=” rounded=false dropshadow=false]Before you even dive into options, it is a good idea to first understand should you even trade options. I have prepared an ebook that has been downloaded by thousands of people all around the world. This powerful, yet easy-to-read book will provide you with key reasons “Why Should you Learn to Trade Options. Download it instantly.[/color-box]

    Buy Low, Sell High

    It’s natural. We are trained for thinking “Buy Low, Sell High”.

    That’s how, in general, investors and traders think about underlying asset. But that’s a stock trader/investor’s mind-set, not an options trader’s. Yes, it is still about “BUY LOW, SELL HIGH” or “SELL HIGH, BUY LOW”, but the way it is done in options trading is different. It’s not right or wrong, it’s just different. Believe me, when you mix “SELL TO OPEN” as first transaction with NEW “options language”, it just becomes a tough nut to crack for beginners. And BUY and HOLD doesn’t work in options simply becuase options has different character than stocks. If you don’t have proper foundation, don’t understand the basics well, there is no reason you should jump into options trading.

    So, Start it right and start it smart!

    [testimonial_slider disable_height_animation=”true” autorotate=”5000″] [testimonial name=”Anna, Singapore” quote=”As a direct result of learning under him, $7000 profit during the last three months alone . My trading skills as well as results have improved significantly.” id=”t1″] [testimonial name=”J, Spain” quote=”0% to 50% with a quite high success rate. As a direct result of OP’s strategies I have made a positive cash flow of $34,000/- within a short period of time.” id=”t2″] [testimonial name=”Luis González, USA” quote=”..16 years witnessing my capital being managed by different brokers….Option Pundit is well tuned with the market and exhibit option trading techniques far more sophisticated than my previous options brokers…” id=”t3″] [/testimonial_slider]

    Give yourself time to equip yourself better before you dive into options trading. There are plenty of books, tools, great websites and articles that can help you in providing a good understanding of options so you can “Act & Think Like an Option Trader“.

    [color-box color=” customcolorpicker=” rounded=false dropshadow=false]Find out the single biggest mistake new options traders make. Read it here.[/color-box]

    A Ticket to Get-Rich-Quick

    Options are trading instruments that provide one with good leverage. Once again, it’s not a straight forward leverage in traditional sense. Options allow you, generally speaking, 1:100 leverage as one standard option controls 100 shares. But if you are an option buyer, you can’t lose more than what you paid for. However, if you are a seller, leverage can work against you.

    A majority of new traders start options trading with the expectations of hitting home run, almost all the time. It is this get-rich-quick unrealistic expectation which then turns into get-poor-quick scenario. They think that Options are something that once they learn money will start to flow automatically and that too in big strides. No, It is just not true. Options are just another tools. Tools that allow to trade market differently vs. stocks or other instruments.

    Think about this- Even after learning the Language of Options, you still need to DEVELOP A MARKET OUTLOOK!! And it’s that outlook which generates money. It’s not options. Options are just more effective tools with much higher probability of profitting for THAT OUTLOOK.

    Making money is a process, a process that takes time to develop and mature. When you start thinking of TRADING as BUSINESS and OPTIONS as BUSINESS TOOLS, you will see success coming your way.

    [color-box color=” customcolorpicker=” rounded=false dropshadow=false] 10 Key Steps for Profitable Options Trading business. Read it here.[/color-box]

    Dull Saw, Sharpened Saw and The Third Point

    Financial markets keep on evolving. There will be newer trading instruments, newer information, new products, new industries and so on. But at the same time, the basics don’t change. The human behaviour towards money, market hasn’t changed much over the last century. Mr market has humbled many traders, regardless of their stature. There is no point in trading the markets with a huge ego based on your past laurels. While ego might work in other areas of life, it is certainly not a helpful tool when dealing with markets. The sooner ego is in check, the better are the results.

    Suppose you came upon someone in the woods working to saw down a tree. They are exhausted from working for hours. You suggest they take a break to sharpen the saw. They might reply, “I don’t have time to sharpen the saw, I’m busy sawing!” Ouch…if you don’t practice enough, you can’t make it perfect. However, spending all your time sharpening and no time sawing is just as bad as spending all your time sawing and not sharpening.  Some people may spend so much time “improving” that they never do any meaningful work.

    The Third Point: Sharpening of saw is done with a pair of files and a specialized bending-pliers called a saw set. And if you mess up the filing, you can end up with a saw that’s permanently ruined! It takes some time, care, and effort to sharpen each individual tooth of a saw, and it takes a set of carefully made tools. And you also need to know a) do you really need to sharpen the saw and b) is it the right time to sharpen the saw?

    At the start of the every trading day, start on the path of getting some real improvement in place. Start keeping a simple trading journal to document everything you do, and any thought or idea that crosses your mind.

    “STAY HUNGRY, STAY HUMBLE” is my basic requirements when dealing with markets. There is no room for “complacency”. You can’t stay the same, you also can’t ignore the new and you also can’t turn a blind eye to your toolbox.

    9 Losers, 1 Winner

    There is an old saying, and a popular one, that 90% of options traders lose money. Though I have my own reservations about this comment, but for now, let’s just accept it. Is this ratio any different from any other carreer? is that any different from another job? How many managers are there for each employee in a successful corporation? Just google to find out How many start-ups survive? 9 Losers, 1 Winner!!

    It is also very well documented that majority of the talented fund managers can’t beat a simple market ETF. In fact, there is a famous bet that Warren Buffet kicked-off in 2008 :

    “Over a ten-year period commencing on January 1, 2008, and ending on December 31, 2017, the S&P 500 will outperform a portfolio of funds of hedge funds, when performance is measured on a basis net of fees, costs and expenses.”

    So, what’s the point? It takes time and effort to take care of your money. There is still 1 winner for every 9 losers. You have to think about it. What is that 1 winner doing differently? Why is that person a winner? Are you going to spend time and efforts to be that 1 person?

    [testimonial_slider disable_height_animation=”true” autorotate=”5000″] [testimonial name=”Anna, Singapore” quote=”As a direct result of learning under him, $7000 profit during the last three months alone . My trading skills as well as results have improved significantly.” id=”t1″] [testimonial name=”J, Spain” quote=”0% to 50% with a quite high success rate. As a direct result of OP’s strategies I have made a positive cash flow of $34,000/- within a short period of time.” id=”t2″] [testimonial name=”Luis González, USA” quote=”..16 years witnessing my capital being managed by different brokers….Option Pundit is well tuned with the market and exhibit option trading techniques far more sophisticated than my previous options brokers…” id=”t3″] [/testimonial_slider]

    There you have it. Options trading is NEW, requires TIME & EFFORT to understand the OPTIONS LANGUAGE and will have its own share of success and failure. If you can’t give it what it takes, it can’t offer you much success even if it is ONE OF THE BEST TRADING INSTRUMENT for retail traders.

    It’s your turn now. What do you think? What are the pros-n-cons of Options Trading? If you were to suggest a new person, what would you tell them?

    Profitable Trading, OP

  • Who Will Ring the Bell?

    Who Will Ring the Bell?

    “Buy America. I am” said Mr Warren Buffett on Oct 16,2 008. He announced to the whole world that he was buying american stocks, and those who listened to him, probably made a great fortune. So will Mr. Buffect announce “Sell America. I am”?

    I have great admiration for Mr Buffett. However, I don’t think we’ll ever see this. So who is going to ring the bell? I don’t know. It’s hard. I will share my three cents.

    Almost 8 months and no major movement.

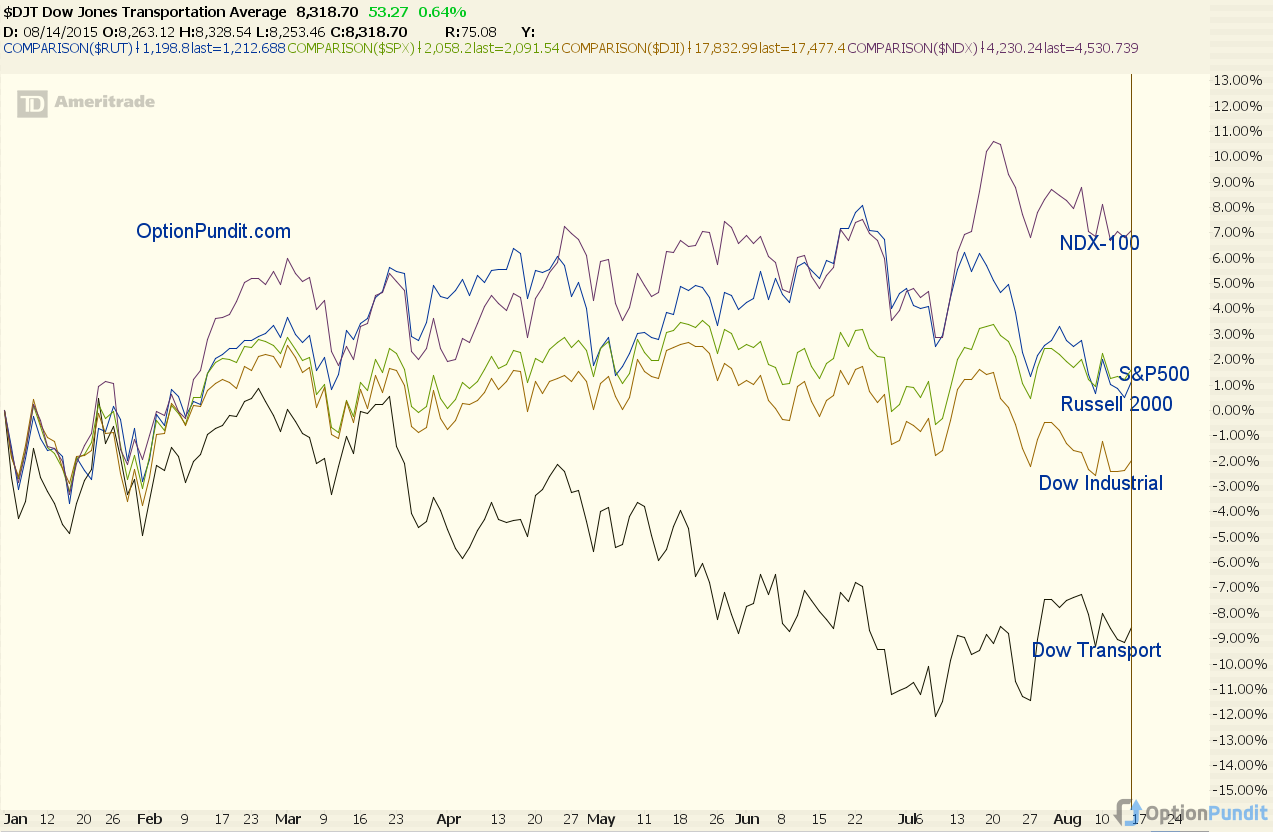
    Call it consolidation or whatever, market price action, at best, now, is “tired”.  Since 2009, Trillions have been pumped into the stock markets (and other riskier assets) and thus market kept on marching higher and higher. But the fact is, since Fed bond purchases stopped last October, markets haven’t been rising as those were during QE times (ok…may be it is still being supported by record corporate buyback..fine). Leave aside NDX extreme on bullish side and Dow Transport on the weakest side, rest are just so so. Economies are not good or else we should be seeing at least 25bps rise by now.

    Performance of Major US Indices YTD

    Dow Vs S&P/Nasdaq/Russell 2000

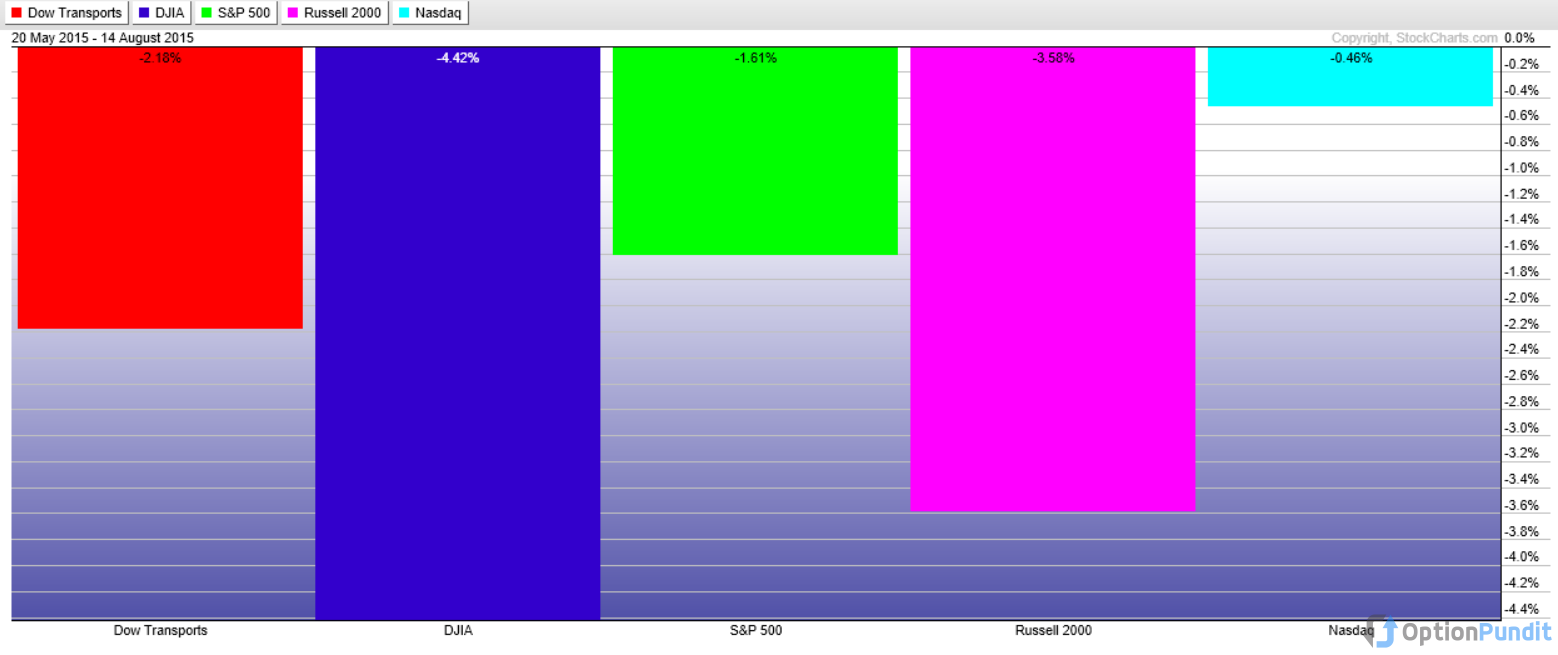
    I highlighted this divergence on May 21, almost 3 months ago. Call it luck or good observation, Dow marked all time high, and since then Dow Jones has lost almost 1000 points. Now, during the past 3 months, both Transports and Industrials are in alignment.

    Performance of Major US Market Indices Since May 20

    What’s interesting though is that S&P500 seems to be holding the fort so far. And as I mentione above, on year-to-date performance basis, S&P500, Russell 2000 and Nasdaq are all up while both Dow Industrial and Dow Transports are down.

    Humm! We’ll soon find out who is right?

    Update on My Indicators

    After extensive research, I developed 4 indicators which have guided me through lot of directional decision (and I have been sharing results on OPN discussion forum). Just like other indicators, sometime these are right while other times not. But whenever it’s right, these do deliver great profits and that’s one of reason I keep using these. As of Friday close, 3 out of 4 indicators are on sell mode and the 4th indicator is currently meaningless due to 8 months of sideways action of the stock market.

    So how do I use this information? I only trade downside, not the upside!! And that’s what I see as my trading action during this week or next as long as these indicate “sell”.

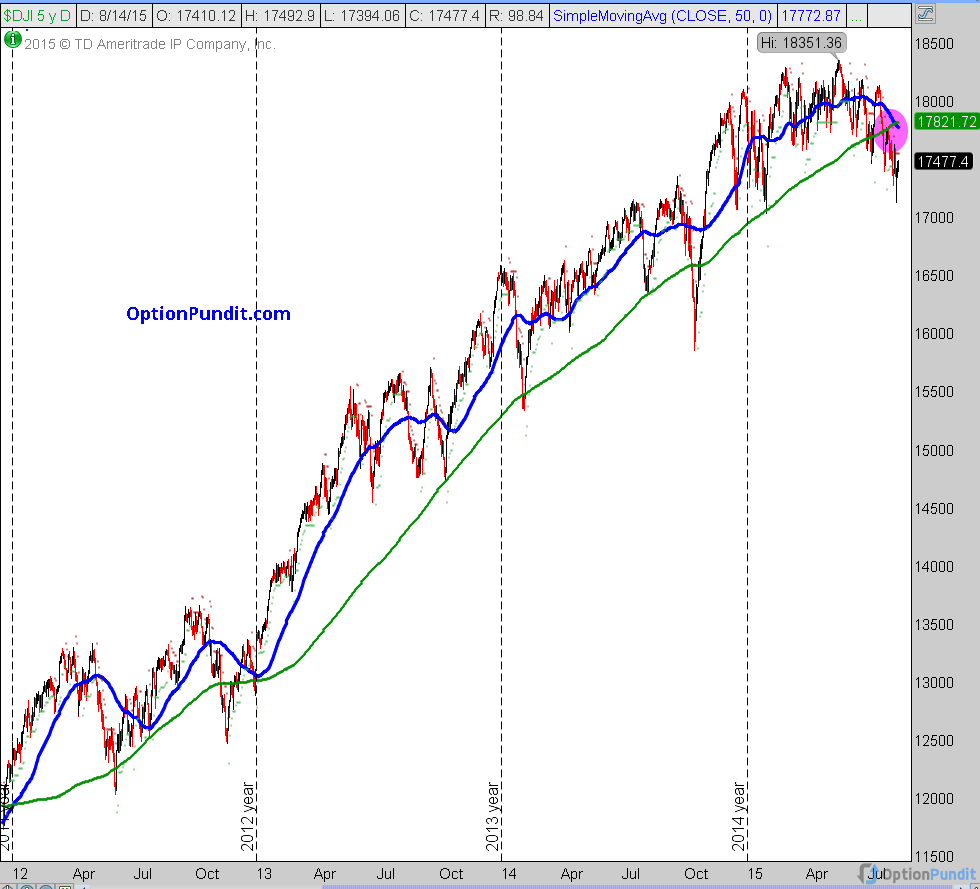
    Dow Deterioration

    Technically speaking, Dow has done enough damage so one has to be careful. Ever since recent bull leg started 4 years ago (Nov’12), now is the first times that 50day moving average is trading below 200days moving average (also known as “death cross”).

    Dow 4 Years

    Albeit, unless 17K is taken out, I don’t think there is much to worry. It’s all play time, and we’ll focus on trades for sideways markets.

    Strong S&P500

    In spite of all the weakness in Dow Industrial and Transports, S&P500 has not weakened as much. So as opposed to Dow Jones, my eyes are focused on S&P500 price action as I see few concerning price patterns on S&P500.
    Without going into mumbo-jumbo of price patterns, lets focus on the numbers that matter.

    • Upside travel path –> 2100, 2115 and then towards 2145+/-
    • Downside Journey –> 2075, 2045, then 1980+/-

    [testimonial_slider disable_height_animation=”true” autorotate=”5000″] [testimonial name=”Anna, Singapore” quote=”As a direct result of learning under him, $7000 profit during the last three months alone . My trading skills as well as results have improved significantly.” id=”t1″] [testimonial name=”J, Spain” quote=”0% to 50% with a quite high success rate. As a direct result of OP’s strategies I have made a positive cash flow of $34,000/- within a short period of time.” id=”t2″] [testimonial name=”Luis González, USA” quote=”..16 years witnessing my capital being managed by different brokers….Option Pundit is well tuned with the market and exhibit option trading techniques far more sophisticated than my previous options brokers…” id=”t3″] [/testimonial_slider]

    So, What’s the Bottom Line

    A lot of people have lost lot of money trying to predict the bear market during these abnormal times since 2009. It’s been almost 4 years and markets have not suffered even a tiny 10% correction. So don’t bet your life on correction.

    Trade the price action, not the forecast. If however, the weakness emerges on S&P 500 (which will be clear based on the numbers I shared above) then it’s time to be courageous and buy volatility and short S&P delta (I don’t mean VIX calls). You can construct that postion via n number of option strategies (simple one is buying plain vanilla puts). Choose the one that you are most comfortable with.

    Vols are low. It’s time to dust-off your options trading skills. Best time to profit is to prepare in advance, not after.

    Have fun and profitable trading, OP

  • Will US Dollar Continue To Strengthen?

    The US dollar index rose quickly over the past few trading days. Other major currencies like the EURO, Pound, Aussie etc weakened against the dollar and I am tempted to short them. However I am hesitant to do so as I noticed that the dollar index is approaching a resistance zone (see the red box in the attached chart). If the dollar index rally falters at resistance, other major currencies may cease to weaken and shorting them will then prove to be a bad decision. If the dollar index slices through resistance easily, I may miss some opportunities but I rather play safe and wait.

    Income Via Future Options

    To me, the only currency that is moving in a clear direction now is the Japanese Yen, which I mentioned in a previous post.

    If the dollar index pushes through resistance and continues its climb, EURO and AUSSIE would become prime candidates to short. I will watch the dollar index closely and provide updates in due course.

    Cheers,
    Ethan